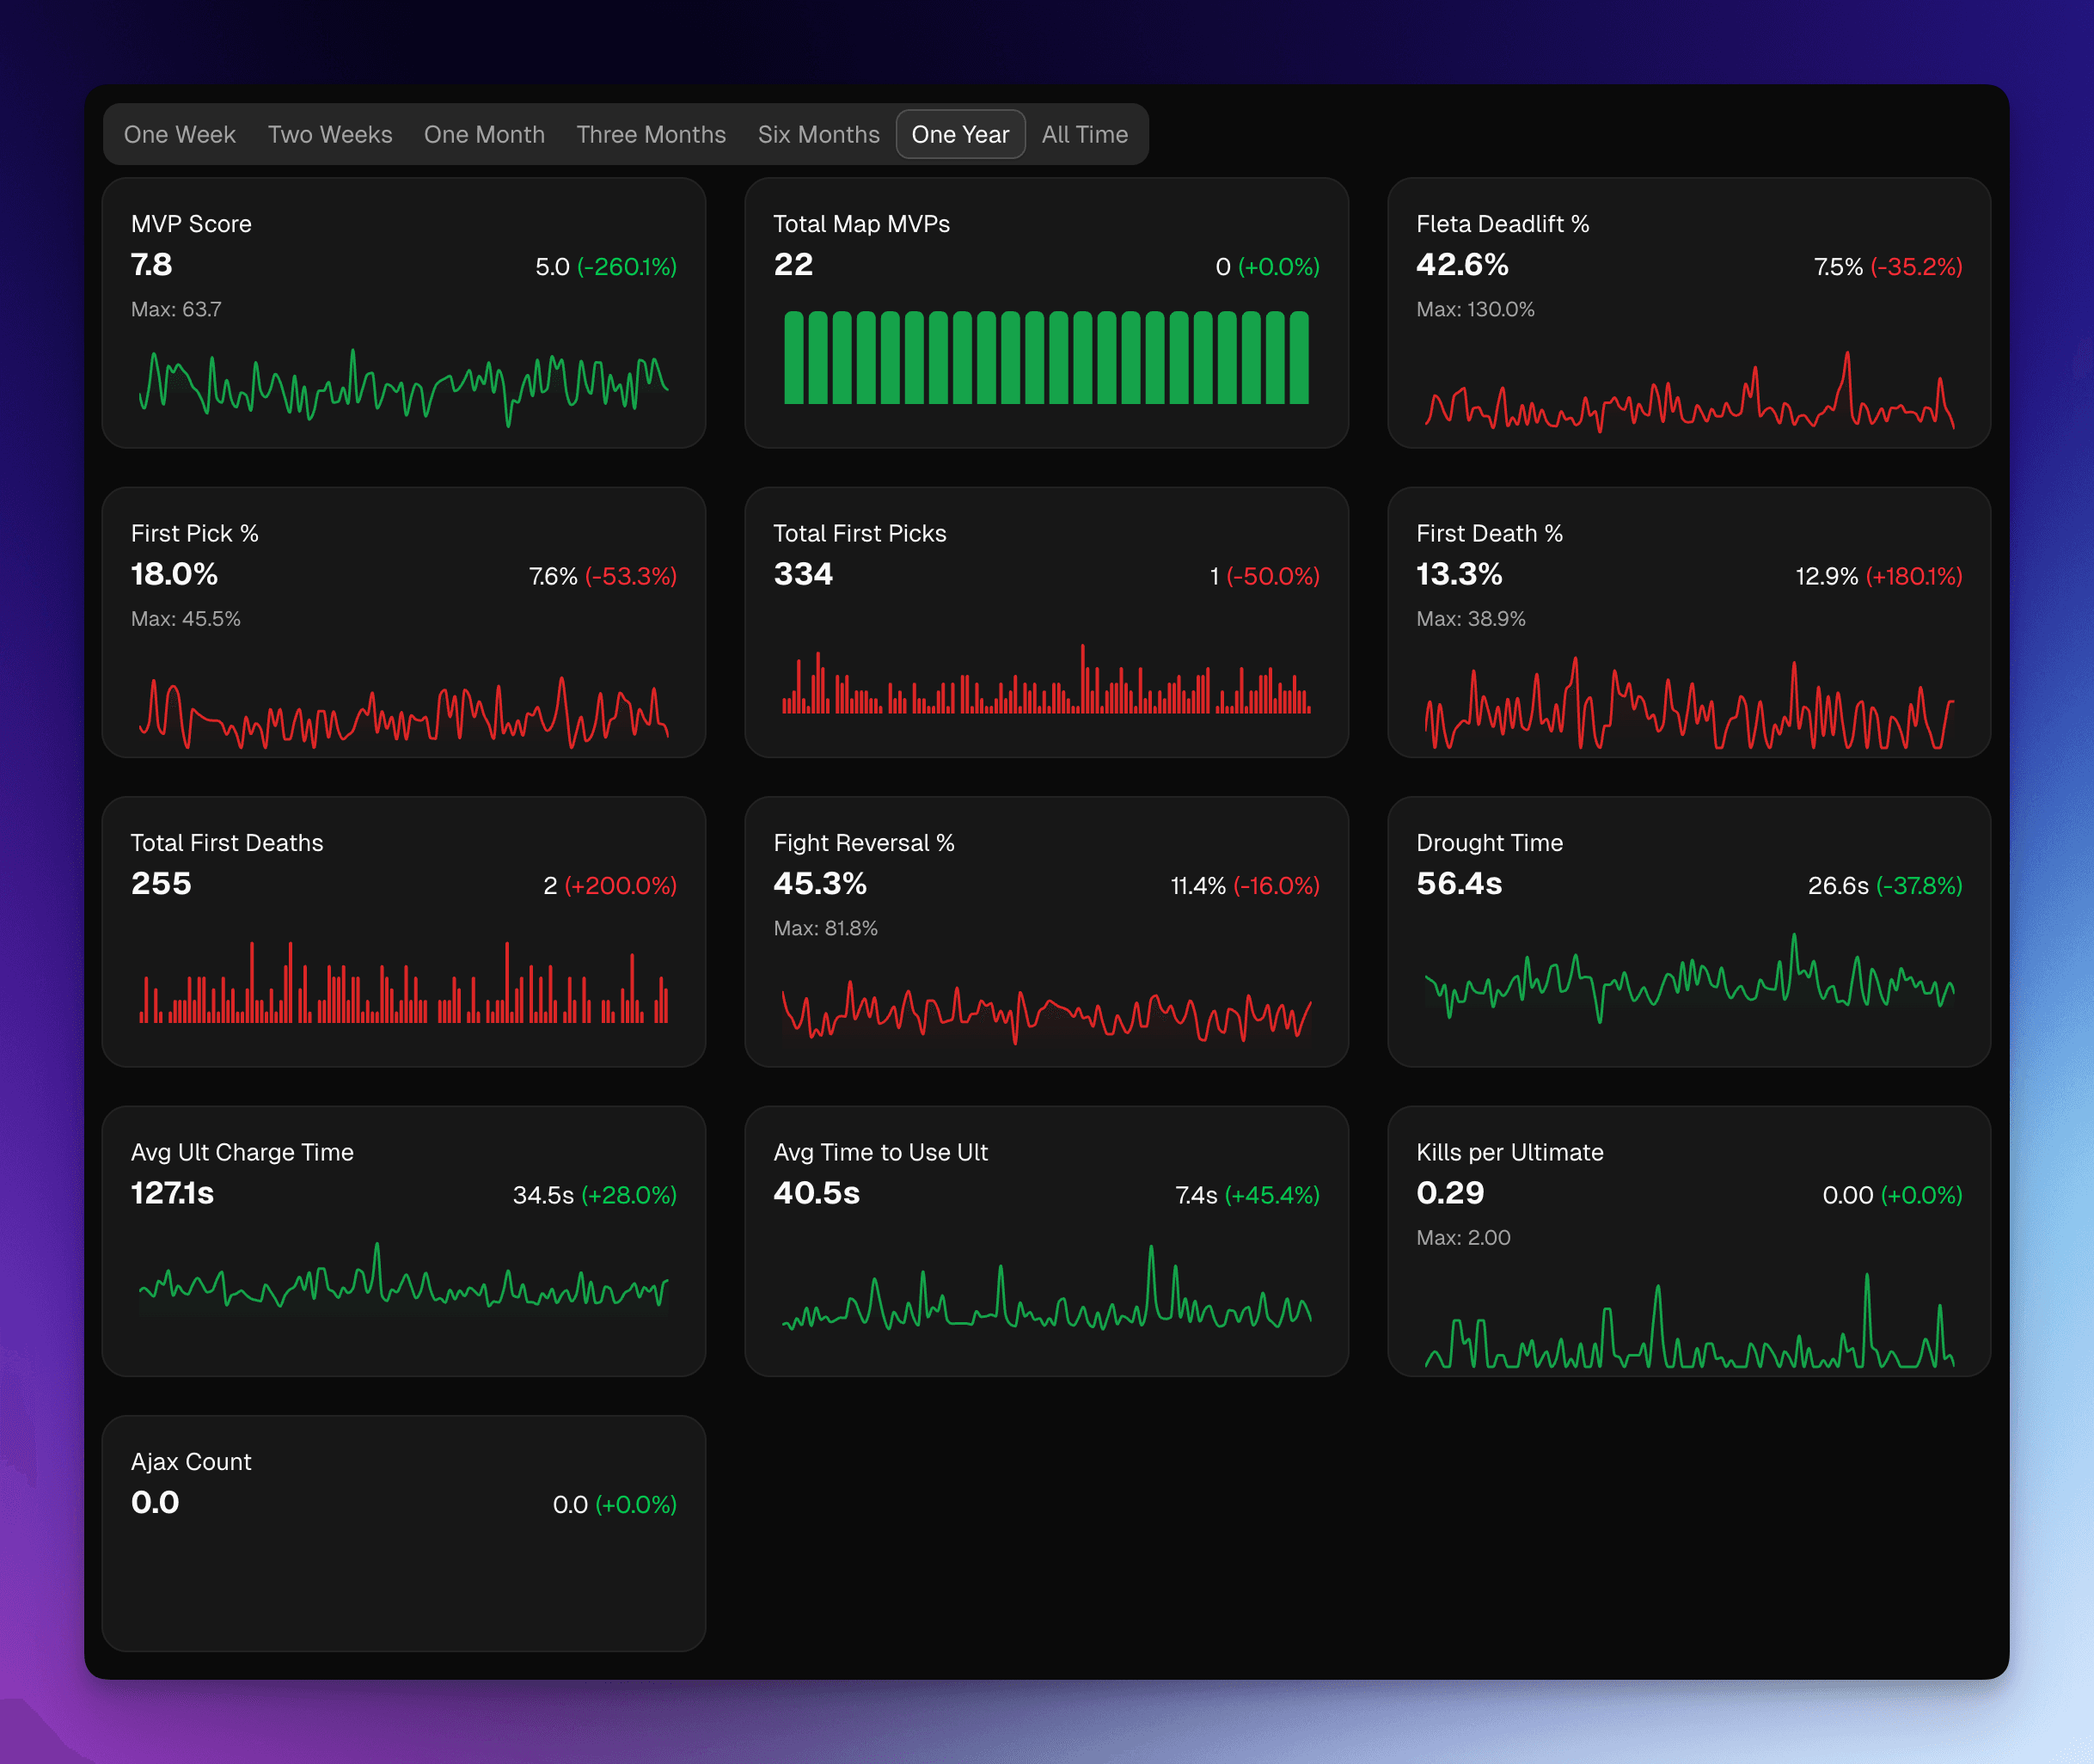
Stat Fluctuation Cards
Visual cards displaying key statistics and their changes over time, with embedded charts.
Available Statistics
MVP Metrics
- MVP Score: Overall performance score (higher is better)
- Total Map MVPs: Count of times awarded map MVP
Impact Metrics
- Fleta Deadlift %: Percentage of team's total damage output
- Fight Reversal %: Percentage of fights won after being down
Engagement Metrics
- First Pick %: Percentage of fights where you got first kill
- Total First Picks: Count of first kills
- First Death %: Percentage of fights where you died first
- Total First Deaths: Count of first deaths
Ultimate Efficiency
- Avg Ult Charge Time: Average seconds to charge ultimate
- Avg Time to Use Ult: Average seconds holding ultimate before use
- Kills per Ultimate: Average eliminations per ultimate used
Ultimate Quality
- Ult Conversion Kills: Average number of kills your team got within 8 seconds and 20 meters of where you started your ultimate, averaged across your ults. It captures the kills the ult actually produced near its impact, not eliminations across the map. Computed once you have at least three ultimates to average. Higher means each ult is generating more value.
- Ult Death %: Percentage of your ultimates during which you died (between the ult starting and ending). A high value means your ults are getting you killed rather than carrying fights.
- Avg Ult Displacement: Average distance, in meters, between where you started and ended an ultimate. High displacement can indicate mobile ults or chasing; low displacement indicates ults used from a held position. Only ults where both the start and end positions are known count toward it.
- Ults On Objective %: Percentage of your ultimates started inside the objective zone rather than off in a lane. Higher generally means your ults are pressuring the point where it counts. This one also needs the map's objective zones to be published; without them it stays a dash even when other ult stats are present.
Positioning
- Avg Engagement Distance: Average 3D distance, in meters, to your target on final blows.
- High Ground Kill %: Share of your kills taken while at least 5 meters above the victim.
- Isolation Death %: Share of your deaths with no teammate within 15 meters.
- Fight Start Spread: Average distance, in meters, to your teammates when fights begin.
For a fuller explanation of what each positioning metric implies about your play, see Positioning.
Special Metrics
- Drought Time: Average time between eliminations
- Ajax Count: Number of clutch multi-kills while critically wounded
The Ultimate Quality and Positioning metrics are computed only from maps that carry positional data, which is available on paid plans (Basic and Premium). On timeframes without enough positional data, these cards show a dash (—) or are omitted. A few of them, such as Ults On Objective %, also depend on the map having published objective zones.
Card Features
Value Display
- Large, bold primary value (average or sum depending on stat)
- Absolute change value since start of timeframe
- Percentage change with +/- indicator
- Green: Positive change (good stats increasing, bad stats decreasing)
- Red: Negative change (good stats decreasing, bad stats increasing)
Maximum Value (for percentage/weighted stats)
- Shows highest value achieved in timeframe
- Helps understand peak performance
Embedded Charts
- Bar Charts: Used for cumulative stats (counts, totals)
- Area Charts: Used for averaged stats (percentages, rates)
- Color-coded by performance (green for positive trends, red for negative)
- X-axis hidden for clean appearance
- Charts show trend over entire timeframe
Timeframe Filtering
Cards update based on selected timeframe in the parent view:
- One Week: Last 7 days
- Two Weeks: Last 14 days
- One Month: Last 30 days
- Three Months: Last 90 days
- Six Months: Last 180 days
- One Year: Last 365 days
- All Time: Complete history
Aggregation Logic
Statistics use appropriate aggregation:
- Sum: Total counts (First Picks, Map MVPs, Ajax Count)
- Average: Rates and percentages (MVP Score, Fleta Deadlift %, Ult Charge Time)
Stat Order
Statistics display in a meaningful order:
- Overall performance (MVP metrics)
- Impact and engagement (Fleta, First Picks/Deaths)
- Fight control (Reversals)
- Ultimate efficiency and quality
- Positioning (spatial metrics)
- Special achievements (Ajax)
Empty State
If no data exists for the selected timeframe, a friendly empty state displays:
- Chart icon
- "No data available" message
- Explanation that data is missing for this timeframe