Overview
The Overview tab provides a comprehensive high-level view of your team's performance, roster, and key strengths and weaknesses. This tab serves as the main dashboard for team statistics.
Features
Quick Stats Card
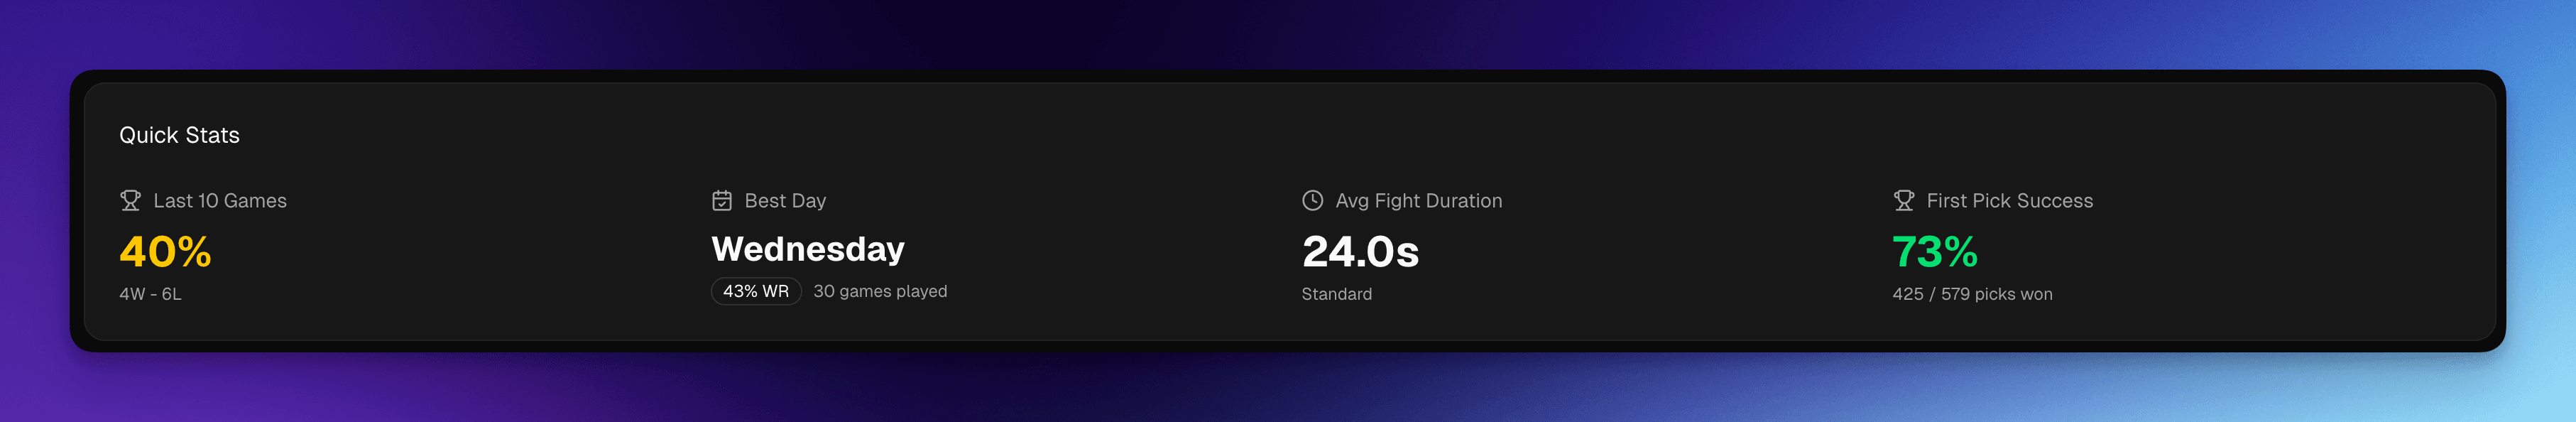
Displays essential performance metrics at a glance:
- Last 10 Games Performance: Win rate and win-loss record for the most recent 10 matches
- Best Day of Week: Identifies which day of the week your team performs best (requires 3+ games per day)
- Average Fight Duration: Average length of teamfights, categorized as:
- Quick fights (< 20 seconds)
- Standard (20-30 seconds)
- Long fights (> 30 seconds)
- First Pick Success Rate: Win rate when your team gets the first pick in a teamfight
Team Roster Grid
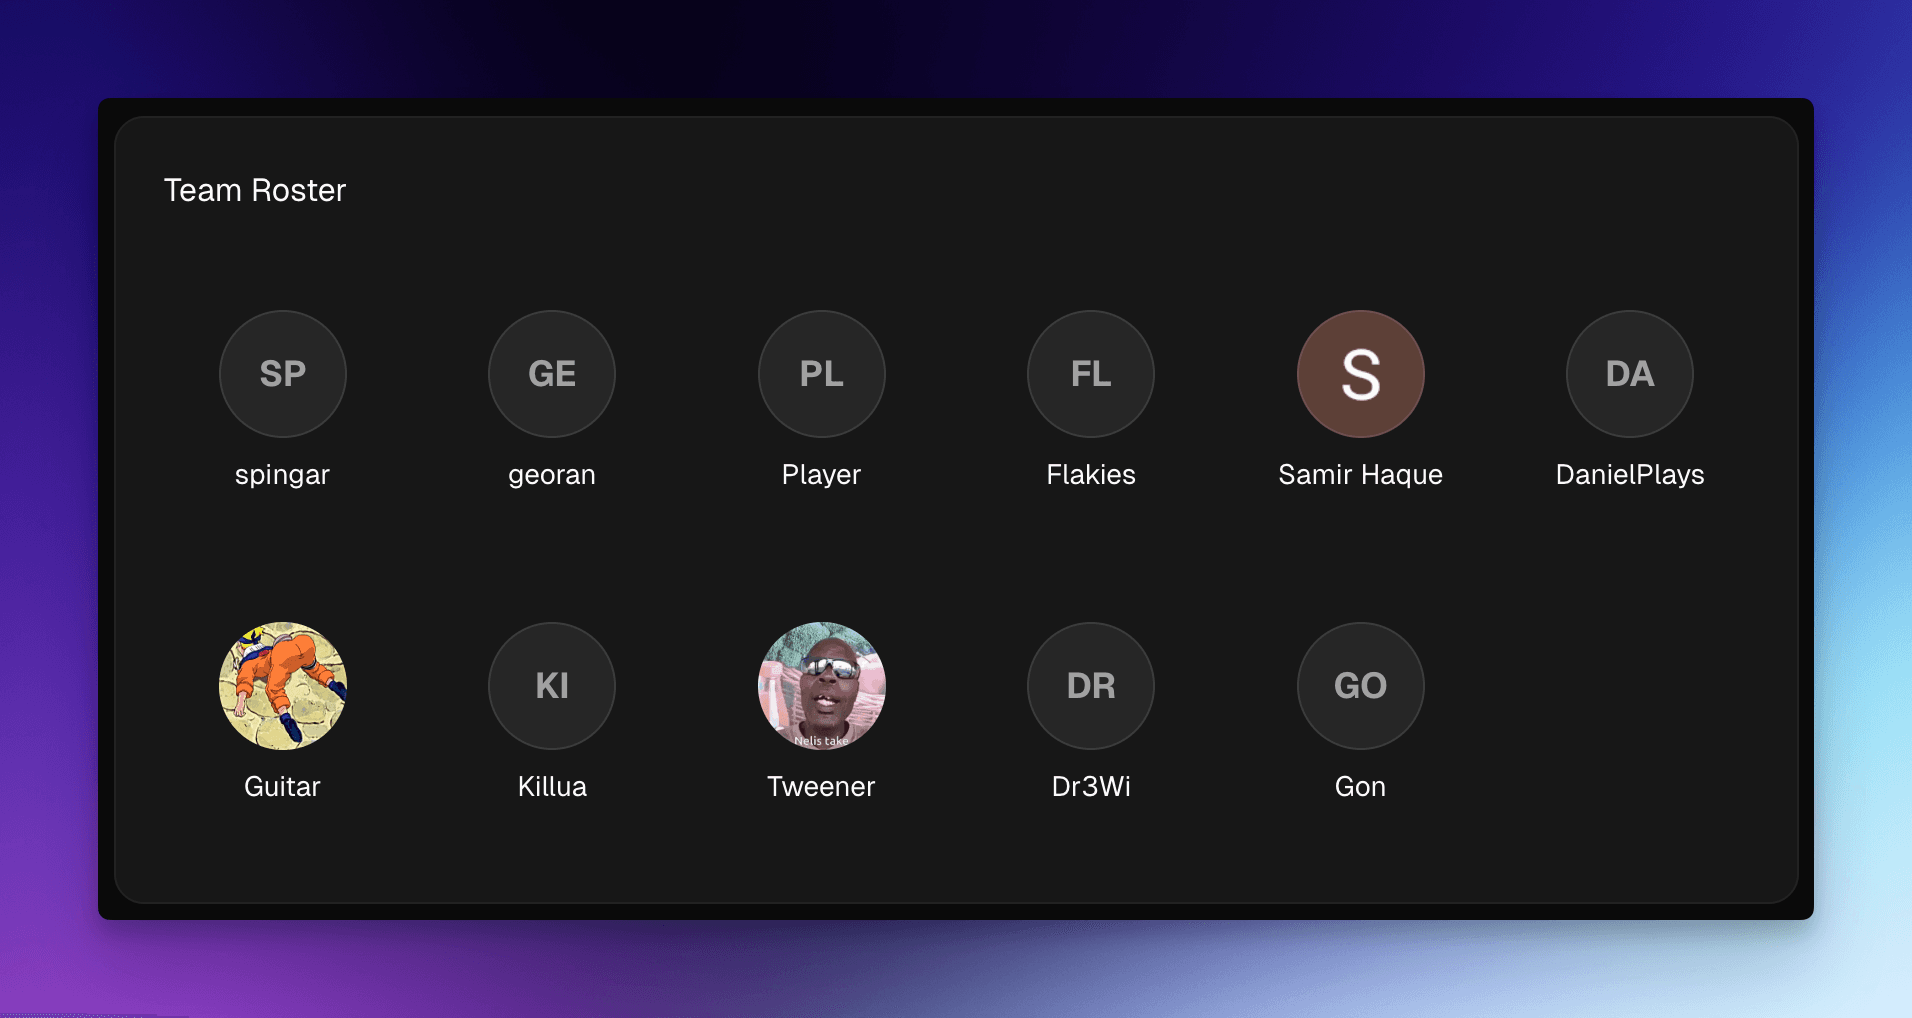
Shows all players currently on the team roster, providing a quick reference of team composition.
Recent Activity Calendar
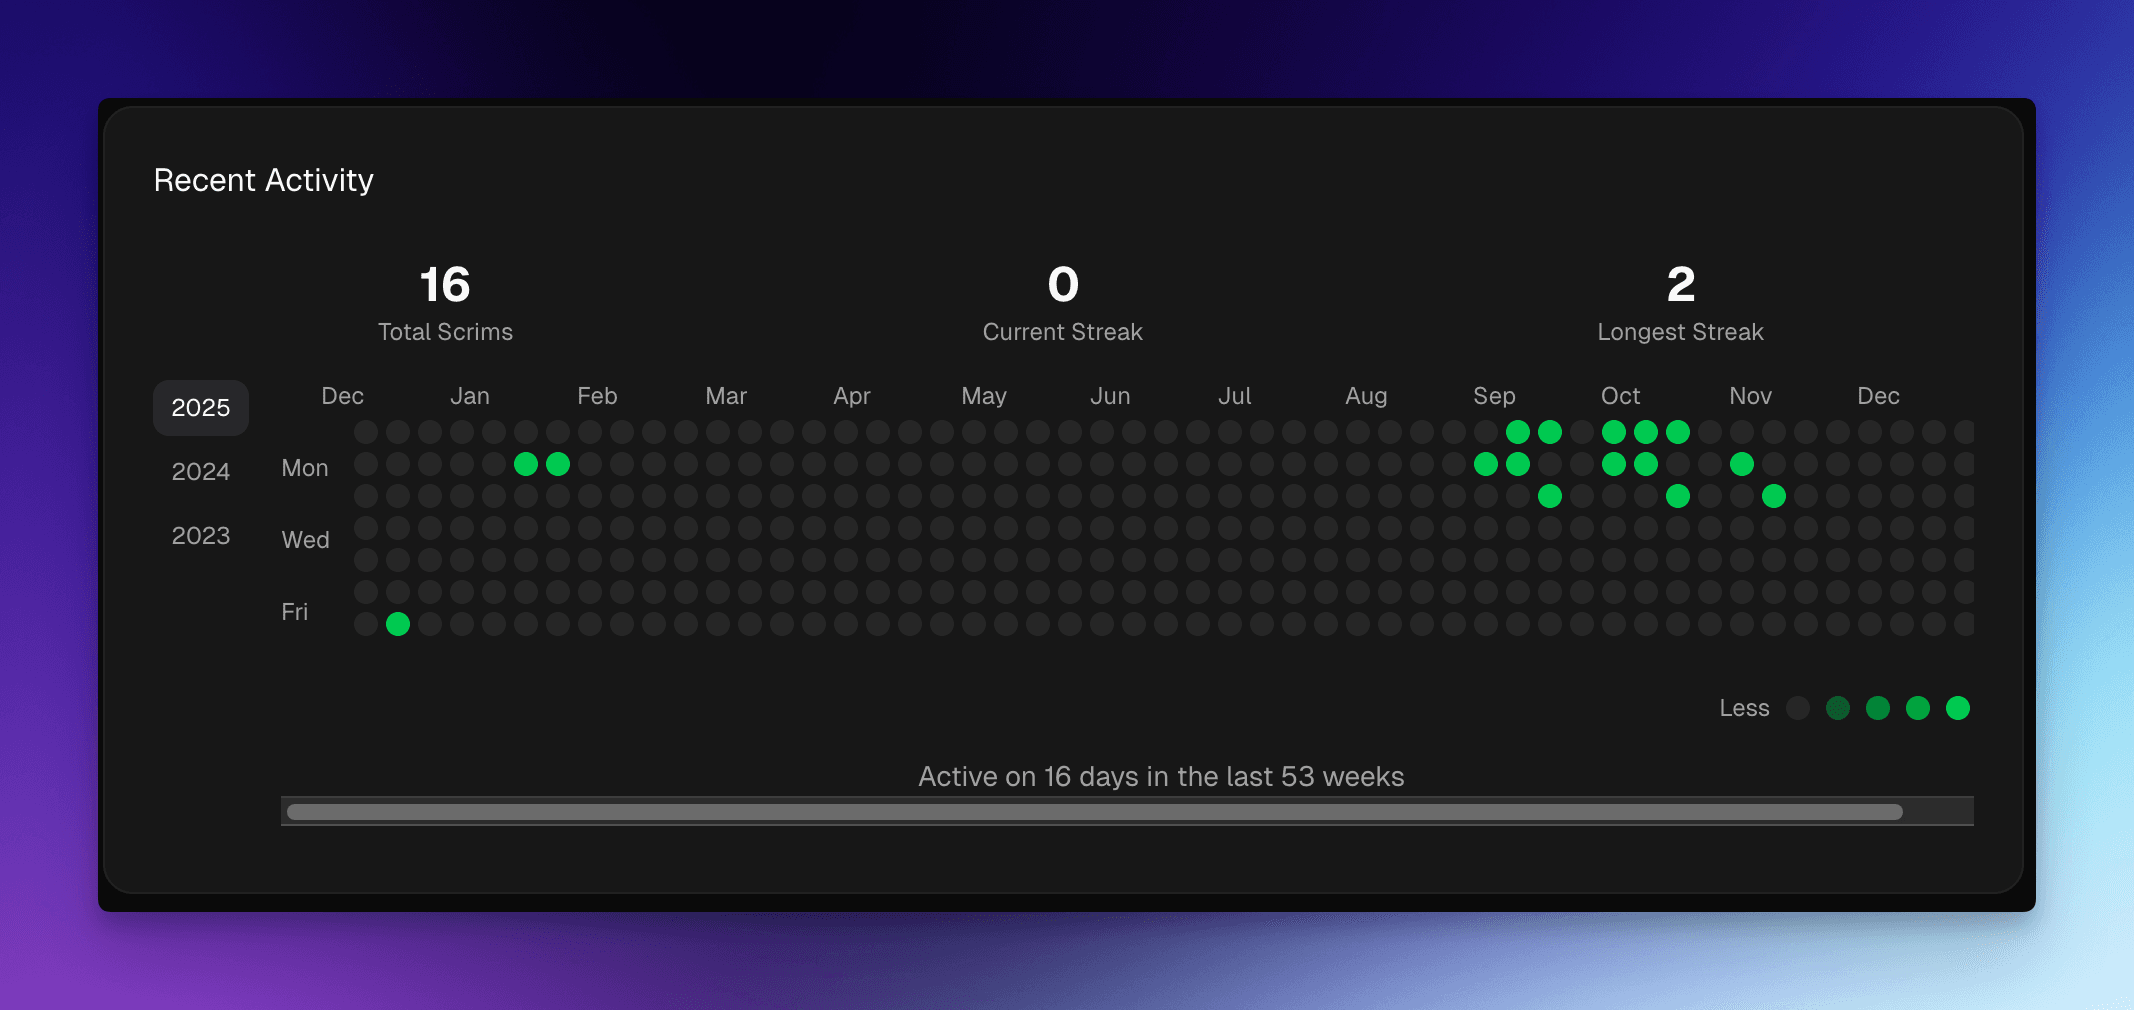
A visual calendar displaying scrim activity over time, helping identify practice frequency and activity patterns.
Top Maps Card
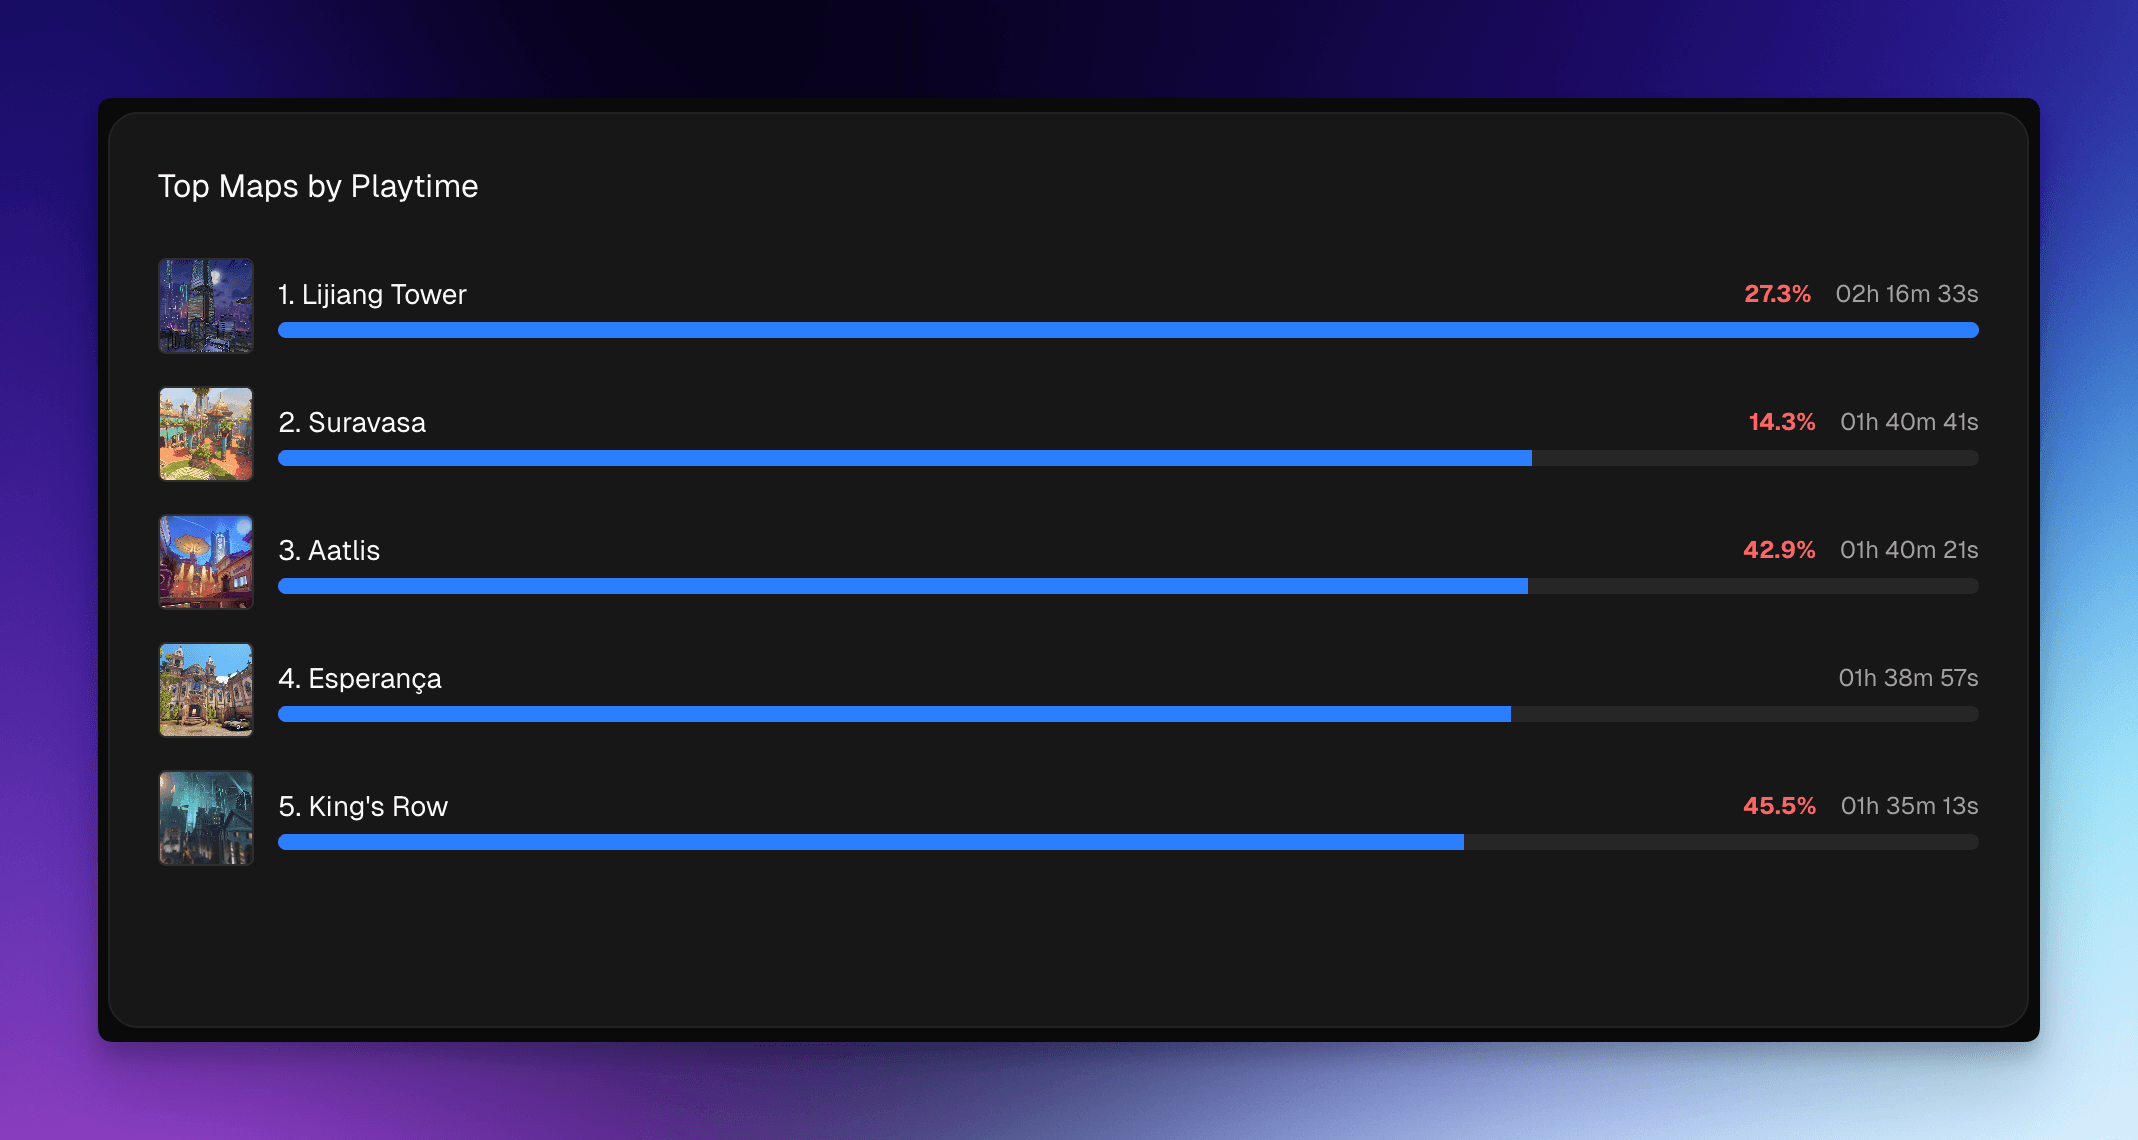
Displays the top 5 maps by playtime, showing:
- Map thumbnails
- Total playtime for each map
- Win rate for each map
- Visual progress bars indicating relative playtime
Strengths & Weaknesses Card
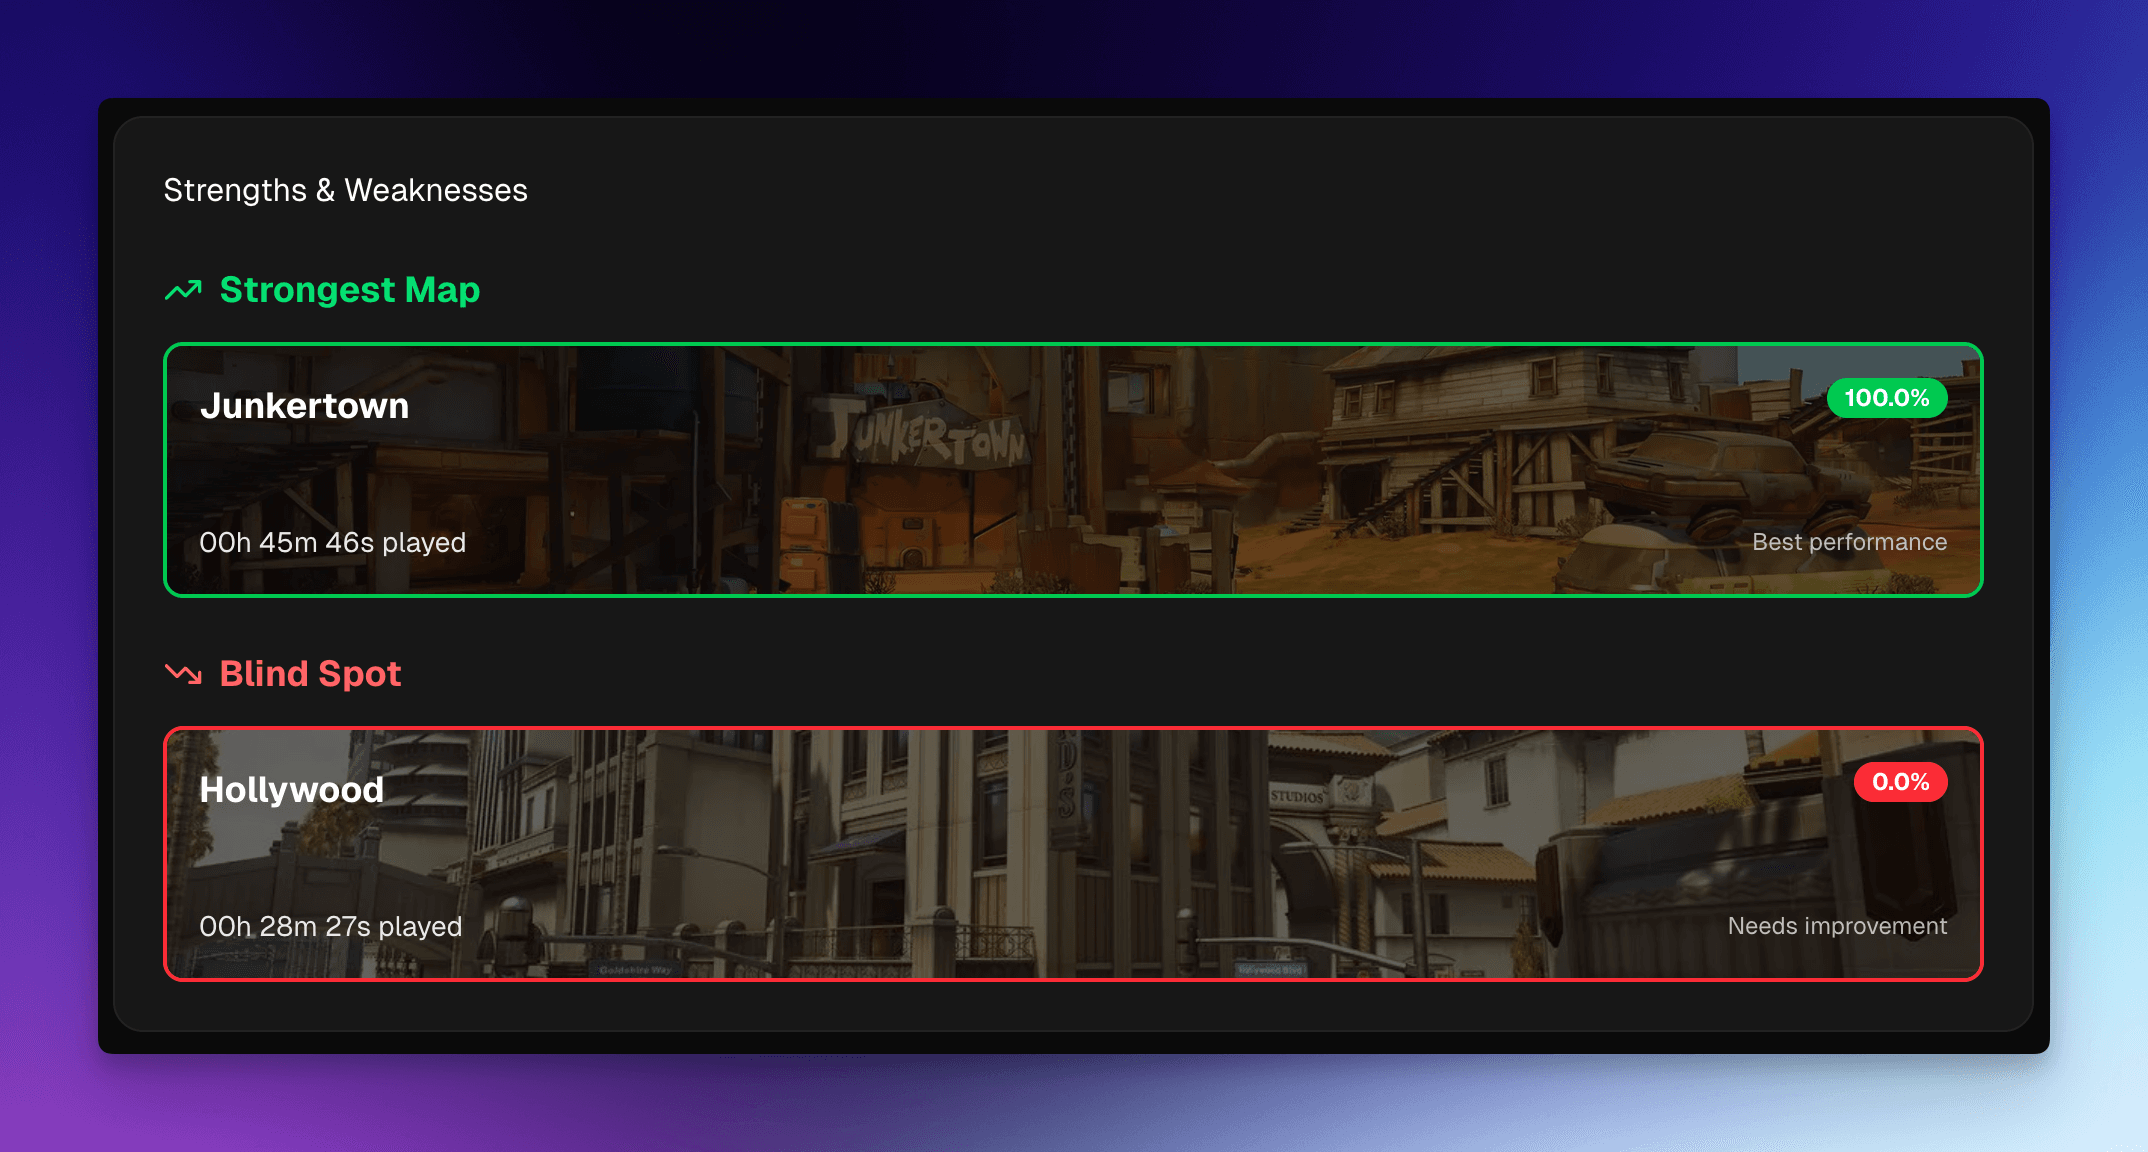
Highlights key map performance insights:
- Strongest Map: Your team's best performing map by win rate (with sufficient playtime)
- Blind Spot: A map where your team has significant playtime but low win rate, indicating an area for improvement
- Both sections include map images, win rates, and playtime information
Role Balance Radar
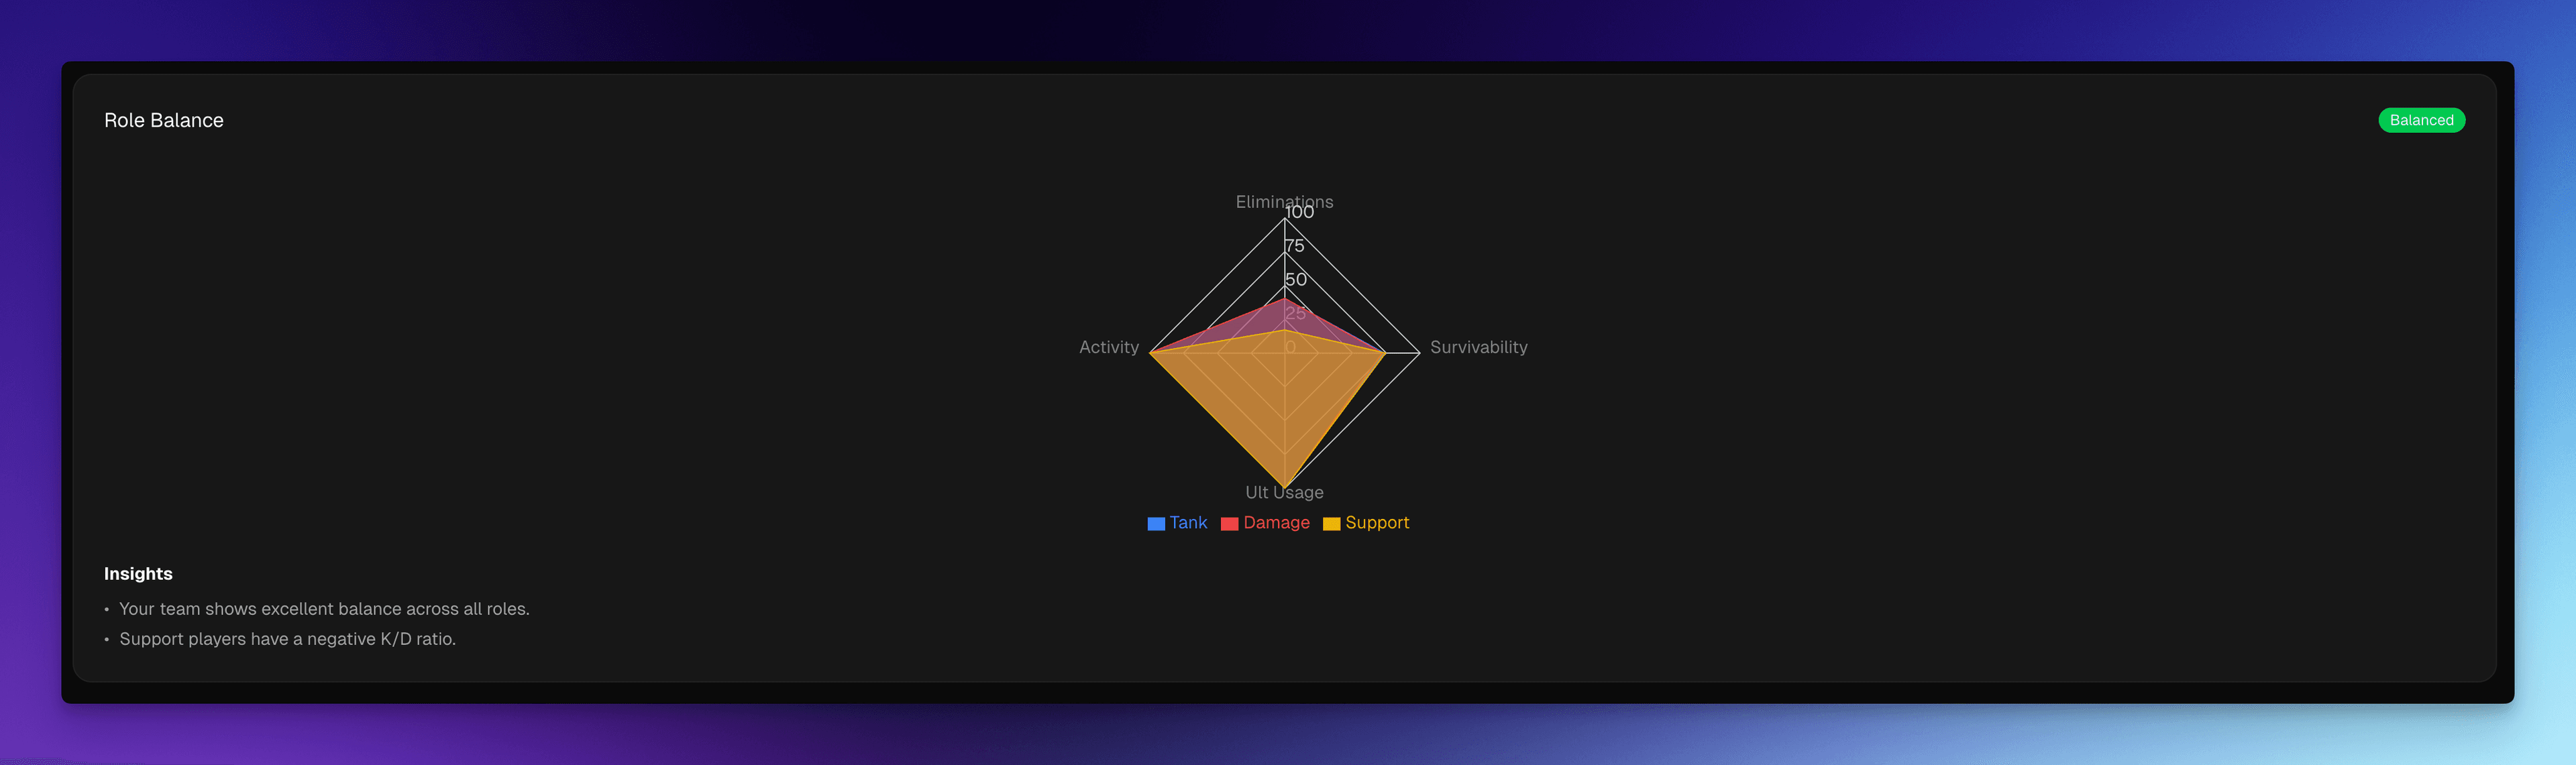
A comprehensive visualization of role performance balance:
- Radar Chart: Compares Tank, Damage, and Support roles across four key metrics:
- Eliminations (K/D ratio)
- Survivability (deaths per 10 minutes)
- Ultimate Usage (ultimate efficiency)
- Activity (total playtime)
- Balance Analysis: Provides insights on role balance:
- Overall balance assessment (Balanced, Tank-heavy, Damage-heavy, Support-heavy, or Insufficient data)
- Identifies strongest and weakest roles
- Balance score (0-100%)
- Actionable insights and recommendations
Substitutes
The team roster grid distinguishes between core roster members and stand-in players. This keeps a one-off substitute from skewing the numbers you use to track your real roster's trends.
If you're a team manager, each player in the roster grid has a control to Mark as substitute (and Unmark substitute to reverse it). Players who aren't managers don't see the control, instead, anyone marked as a substitute shows a passive SUB badge so the whole team can see who is a stand-in.
Once a player is marked as a substitute, their stats are excluded from team-level aggregates. That means the substitute no longer contributes to the team's rollups, including the charts on Charts, the Team Skill Rating (TSR), player intelligence, and other team-wide statistics. The substitute's individual map and scrim stats are still recorded and viewable, they just don't pull the core roster's averages around.
Marking a player as a substitute only affects team-level aggregates. It does not delete or hide any of that player's data, and you can unmark them at any time to fold their stats back into the team totals.
Use Cases
- Quick Performance Check: Get an immediate sense of team performance with the Quick Stats card
- Roster Management: View current team composition
- Practice Planning: Use the activity calendar to track practice frequency
- Map Strategy: Identify top maps and areas needing improvement
- Role Assessment: Understand team balance and identify which roles may need more focus
Key Insights
The Overview tab helps answer questions like:
- How is the team performing recently?
- Which maps should we focus on?
- Are our roles balanced?
- What are our biggest strengths and weaknesses?