Teamfights
The Teamfights tab provides in-depth analysis of teamfight performance, ultimate economy, and win probability factors. This tab helps teams understand the micro-level aspects of gameplay that determine fight outcomes.
Features
Team Fight Stats Card
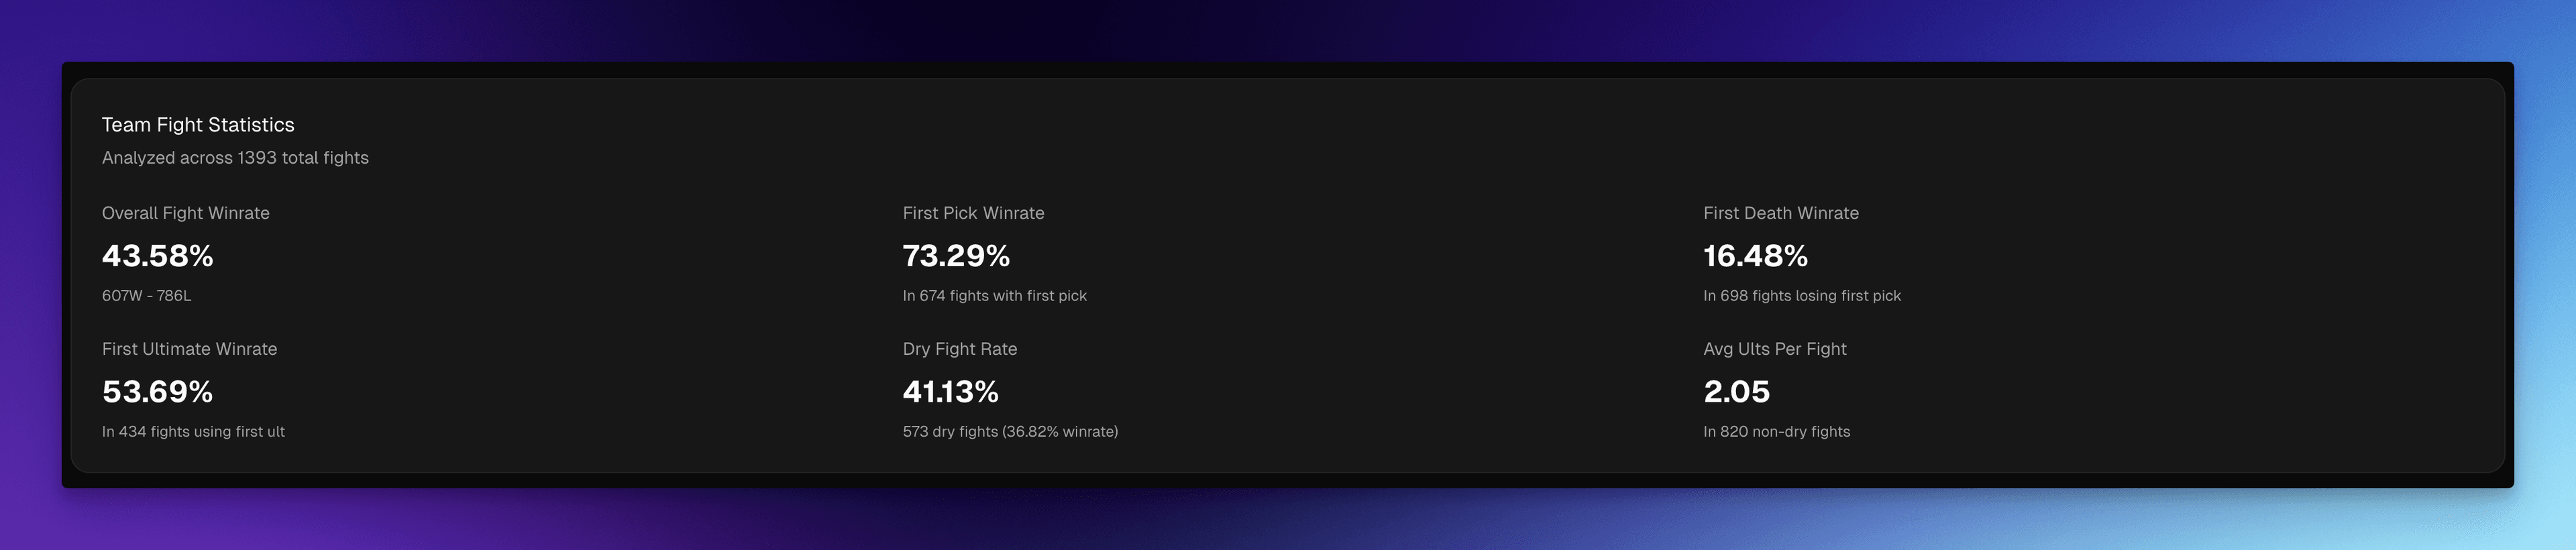
Comprehensive statistics about teamfight performance:
Key Metrics:
- Overall Fight Winrate: Percentage of teamfights won
- First Pick Winrate: Win rate when your team gets the first elimination
- First Death Winrate: Win rate when your team suffers the first death
- First Ultimate Winrate: Win rate when your team uses the first ultimate
- Dry Fight Statistics:
- Percentage of fights with no ultimates used
- Win rate in dry fights
- Average Ultimates Per Fight: Average number of ultimates used in non-dry fights
Insights:
- Understand the importance of first pick/death
- Track ultimate usage patterns
- Identify fight initiation effectiveness
- Measure fight consistency
Ultimate Economy Card
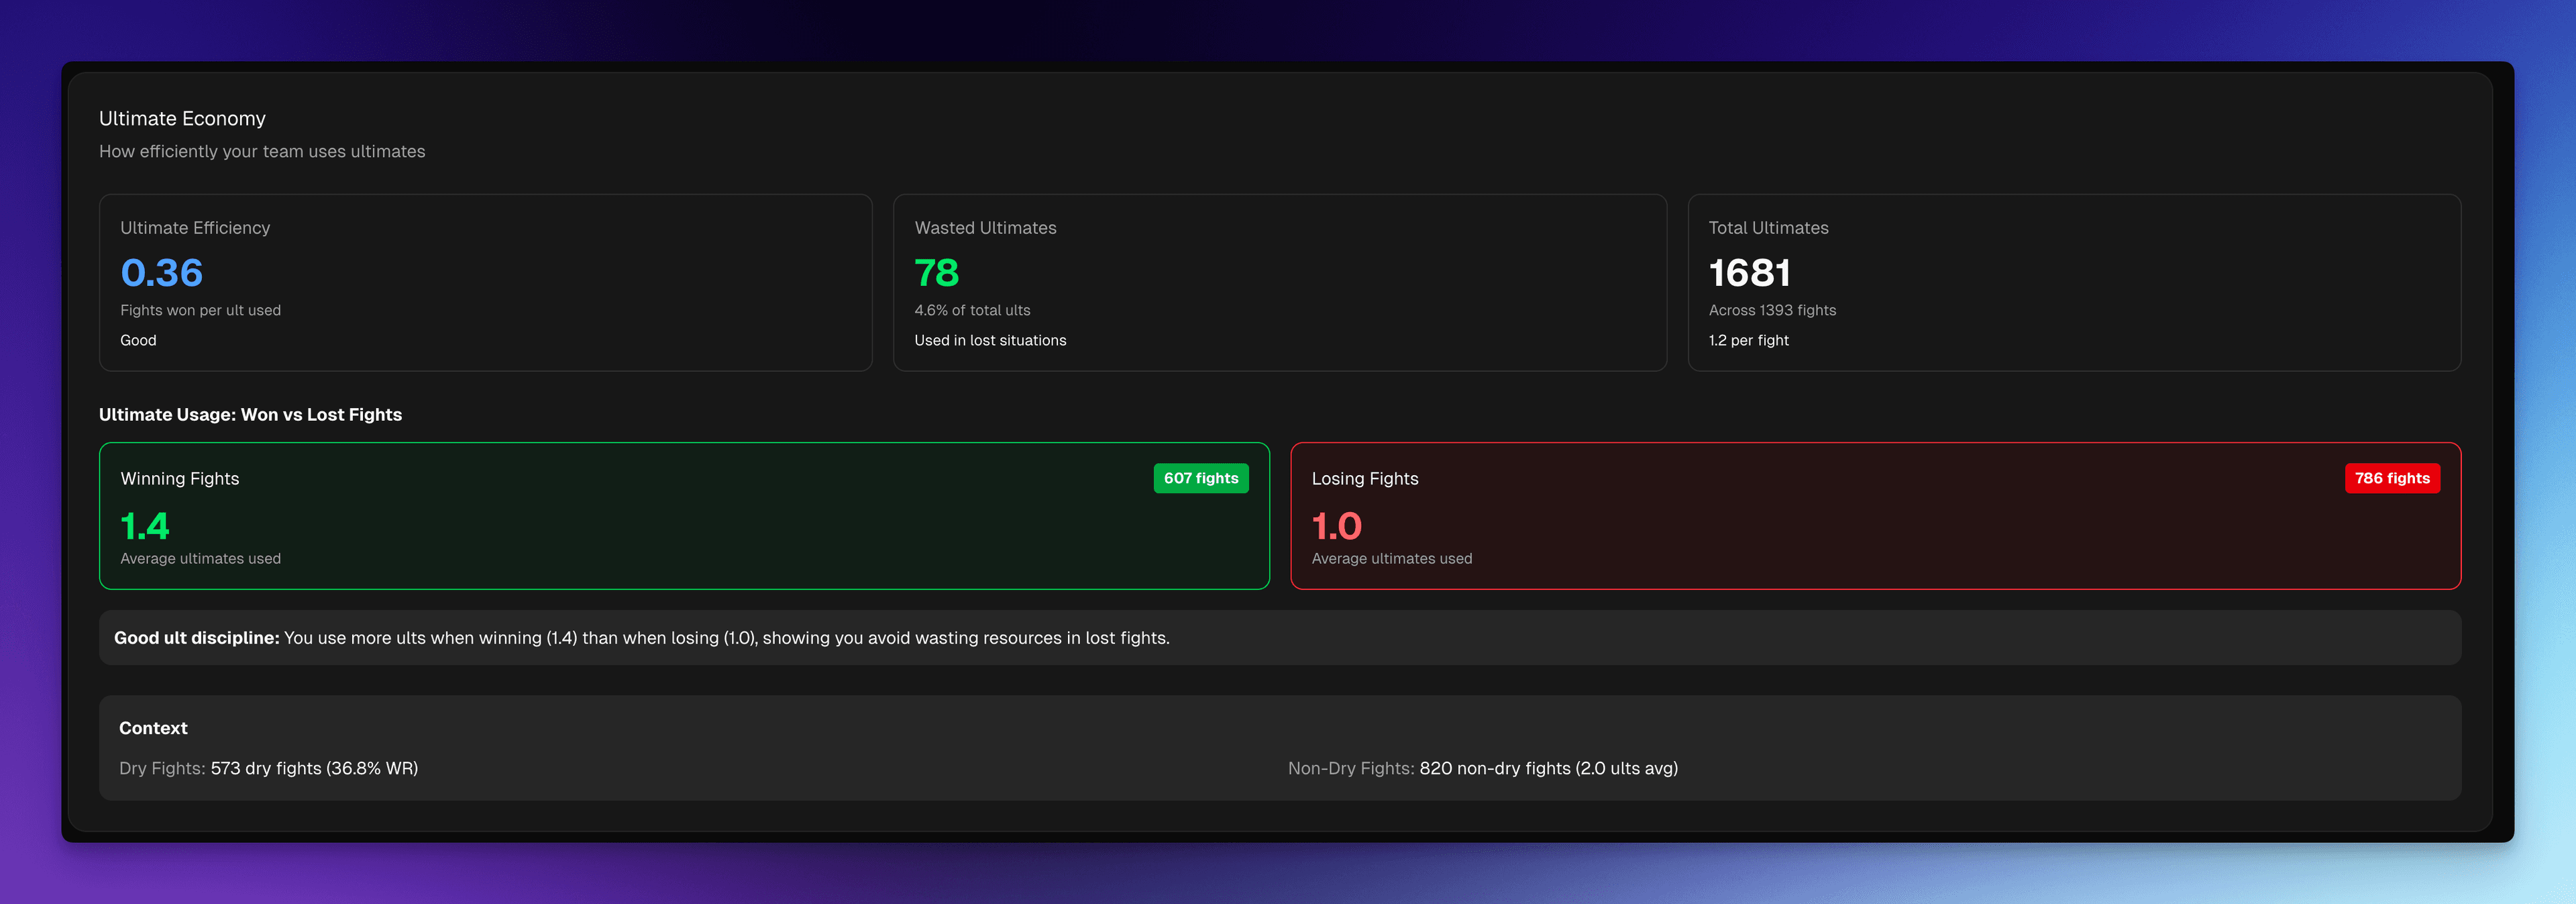
Detailed analysis of ultimate usage and efficiency:
Main Metrics:
- Ultimate Efficiency: Fights won per ultimate used (higher is better)
- Excellent: ≥0.40
- Good: 0.25-0.39
- Average: 0.15-0.24
- Poor: <0.15
- Wasted Ultimates: Count and percentage of ultimates used in losing situations (after 3+ player disadvantage)
- Total Ultimates Used: Overall ultimate usage across all fights
Usage Timing Comparison:
- Winning Fights: Average ultimates used in won fights
- Losing Fights: Average ultimates used in lost fights
- Insights: Compares ultimate discipline between winning and losing scenarios
Context Information:
- Dry fight statistics and win rate
- Non-dry fight count and average ultimates
- Overall fight distribution
Use Cases:
- Identify if ultimates are being used efficiently
- Understand when ultimates are wasted
- Improve ultimate economy management
- Learn optimal ultimate timing
Win Probability Insights
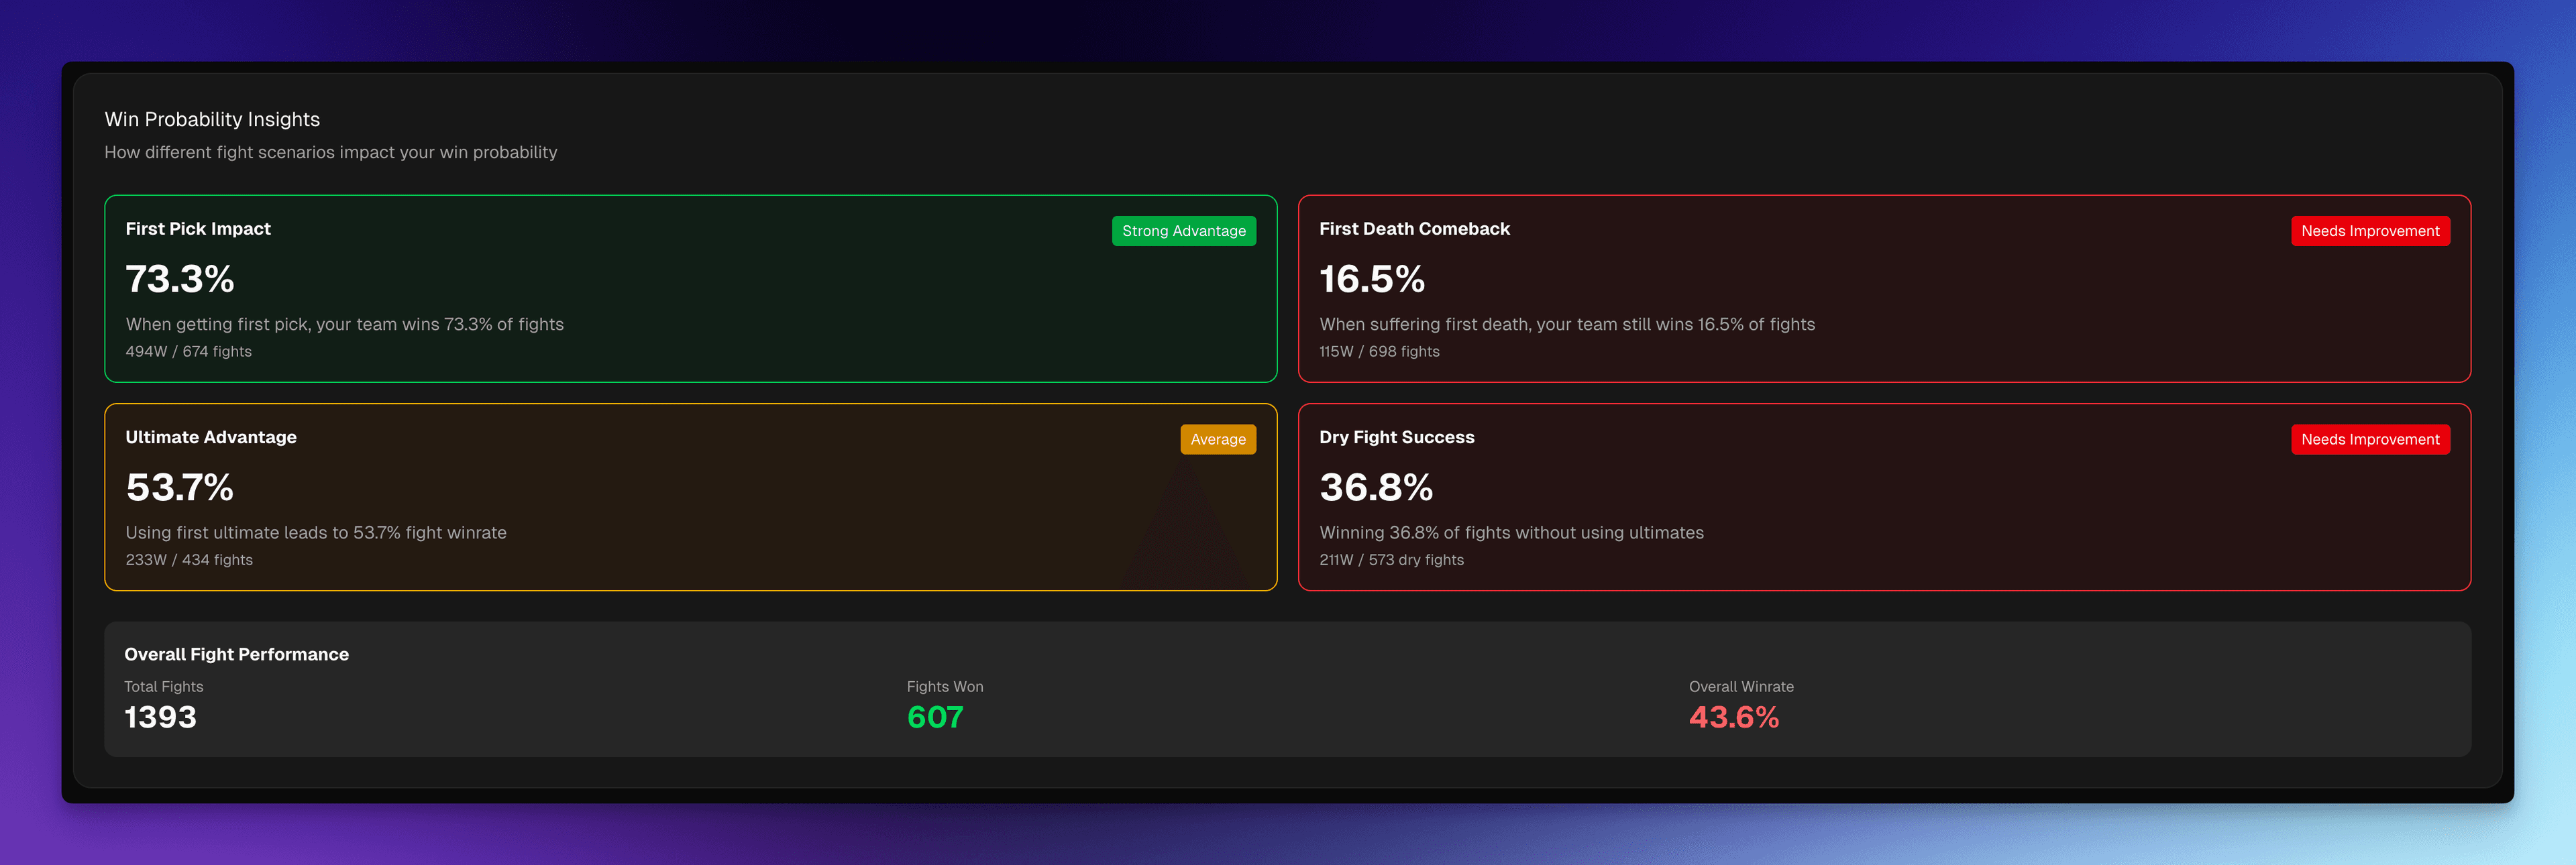
Analysis of factors that correlate with fight wins:
Features:
- Key Factors: Identifies which factors most strongly predict fight outcomes:
- First pick advantage
- First ultimate advantage
- Ultimate economy
- Player advantage timing
- Probability Calculations: Shows win probability based on various scenarios
- Recommendations: Actionable insights on:
- When to engage
- When to disengage
- Ultimate usage timing
- Fight initiation strategies
Insights Provided:
- Which advantages matter most
- Optimal engagement conditions
- Risk assessment for different scenarios
- Strategic recommendations
Fight Reversal Metrics
Fight reversal metrics track the fights your team wins after falling behind, the clutch and comeback fights that often decide close series. These metrics are free for all users.
What Counts as a Reversal
A reversal is a fight where your team was losing, for example, you took the first death or were at a numbers disadvantage, and came back to win it anyway. Parsertime splits reversals into two categories:
- Dry reversals: no kills were traded. The fight fizzled and reset: one side backed off, the losing team regrouped, and the fight effectively didn't resolve into a traditional win.
- Non-dry reversals: kills were traded and the losing team flipped the fight outright. These are the true comeback wins.
Where to Find It
The non-dry reversal rate shows up in two places:
- Ultimate Economy card on the scrim overview, so you can see reversals in the context of individual maps.
- Win Probability Insights card here on the Teamfights tab, alongside the other factors that correlate with fight wins.
How to Read It
A high non-dry reversal rate means your team wins fights they should have lost, you trade back, hold composure under pressure, and convert bad starts into clean wins. That's often the margin in close matches.
A low non-dry reversal rate means bad starts stay bad. When that pattern shows up, work on disengage rules and shot-calling after first deaths, rather than trying to prevent every bad start.
Team Fight Initiation
The Teamfights tab includes a Team Initiation card that aggregates how your team opens fights across all of its scrims, who goes in first, how often, and whether it pays off.
"Going first" here means initiating the engagement — your team throwing the first punch and committing resources — not landing the first kill. Parsertime reads initiation as a team commitment: it looks for several players engaging together (or a hard commit like an offensive ultimate), not a single big damage spike. That is why a lone sniper pick does not register as your team going in, but a coordinated dive does. It keeps these numbers tied to real team decisions you can coach against. For the fight-by-fight evidence behind each call, use the per-map Fight Initiations breakdown.
The card surfaces three numbers:
- Initiation win rate: your win rate in the fights your team initiated (went in first), along with the won-lost record behind it.
- Initiation frequency: how often your team went in first across the fights that had a clear initiator.
- Going second win rate: your win rate in the fights where the opponent initiated, so you can compare playing on the front foot against reacting.
Reading these together tells you whether initiating is a strength or a habit worth reconsidering. A high initiation frequency paired with a low initiation win rate, for example, suggests your team is forcing fights it isn't favored to win. Comparing the initiation win rate against the going second win rate is the win split — it tells you directly whether your team is better on the front foot or reacting, which is one of the more actionable reads on the page.
Team Fight Initiation needs at least 2 scrims of data to aggregate. The card discloses how many of your fights it could actually label (for example, "based on 41 of 58 fights") so you know the sample behind the numbers. Fights without a clear initiator — including contested starts, where both teams committed at almost the same moment — are excluded. Maps logged before the detailed log format can't be analyzed for initiation and don't contribute to these totals.
For initiation broken down on a single map, rather than rolled up across the team, see the per-map Fight Initiations breakdown.
Key Insights
The Teamfights tab helps answer questions like:
- How effective is our teamfight execution?
- Are we using ultimates efficiently?
- What factors most influence our fight outcomes?
- When should we engage or disengage?
- How can we improve our ultimate economy?
Use Cases
- Strategy Development: Understand what makes fights successful
- Ultimate Management: Improve ultimate usage efficiency
- Engagement Timing: Learn optimal fight initiation
- Performance Review: Identify micro-level weaknesses
- Practice Focus: Determine what to work on in scrims
Data Requirements
- Requires detailed fight data from scrims
- Needs kill/elimination timestamps
- Ultimate usage tracking
- Player advantage state tracking
Best Practices
- Review ultimate economy regularly to avoid waste
- Track first pick/death win rates to understand engagement effectiveness
- Use win probability insights to inform decision-making
- Compare ultimate usage between winning and losing fights
- Focus practice on identified weaknesses
Terminology
- Dry Fight: A teamfight where no ultimates are used
- First Pick: The first elimination in a teamfight
- First Death: The first death suffered by your team
- Wasted Ultimate: An ultimate used when already at a 3+ player disadvantage
- Ultimate Efficiency: Ratio of fights won to ultimates used